Part of the H2020 nuMIDAS project encompasses the development of a data & solutions toolkit for mobility services, whose outcomes and potential products can be supportive in shaping policy, in decisions and in managing mobility services. Within this toolkit, one of the aims is to create a dashboard tool that provides mobility managers, planners and policymakers with valuable insights on the deployed mobility services’ KPIs and is supportive for setting up and evaluate the goals for smart mobility in their city or region. NuMIDAS partner MAPtm- a service provider based in Utrecht and specialized in traffic management- will develop this dashboard tool, building upon their vast experience. In this article, we highlight some of the interesting dashboard projects recently developed by MAPtm.
Looking back at MAPtm portfolio of projects, one of the first new approaches for the use of a dashboard materialized in the development on an Incident Management viewer, based on the crowdsourced data from Waze which is used by the Traffic Management Centres (TMCs) of Rijkswaterstaat (part of the Dutch Ministry of Infrastructure and Water Management), the region of Flanders and the municipalities of Amsterdam and Nijmegen. In 2020, a real-time and historical dashboard was developed for the city of Nijmegen to monitor traffic conditions, including incidents and accidents, weather conditions, occupation of parking, the status of Traffic lights and Dynamic Route Panels, among others.
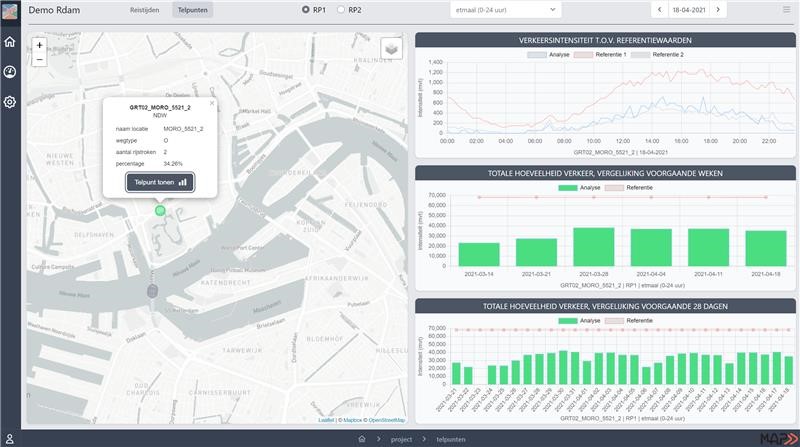
Besides real-time monitoring, MAPtm has developed several dashboards for historic purposes. These dashboards can be used for evaluation studies of several events, such as roadworks or big public events, and to assess the performance of traffic according to policies, by showing the measured travel time on a route and also indicating whether the performance matches a current policy. A clear example of the integration of all of these features is the Bereikbaarheidsmeter (Accesibility Meter) developed for Amsterdam Bereikbaar, a platform of public organizations committed to ensure the accessibility of the region. In this dashboard, multiple routes between a set of origins and destinations were considered and the performance of the routes based on travel time was determined according to a system classifying the travel time as either good, acceptable, critic, bad or unacceptable. These features were available for both motorised traffic and public transit, guaranteeing that the accessibility of the Amsterdam region is both monitored and comparable between modalities.
Other examples include the infraMonitor, a configurable dashboard with a strong focus on more detailed monitoring during roadworks. Since multiple roadwork projects require focus on a different set of routes, it is very hard to configure a dashboard that is useful for monitoring of current roadworks as well as future ones. By using the infraMonitor dashboard, users can overcome this problem and configure their own set of routes and data-points to monitor their project, are able to save it for future uses and moreover, can configure the set of KPIs that need to be calculated. Overall, this gives the user the freedom to evaluate one route with a certain amount of extra travel time above normal, while other routes are compared with, for instance, twice the normal travel time.
Using these experiences as a foundation, MAPtm is looking forward to keep pushing the boundaries of dashboard development in the framework of the nuMIDAS project, designing innovative solutions which respond to the specific and emerging mobility challenges present in an array of European cities.


