


The main goal of this task is to ensure that the methods and tools identified during the development of the nuMIDAS dashboard meet the end users’ expectations and that the usability is analysed based on end-user experiences. The collection of end-user preferences and experiences from stakeholders makes it possible to investigate how the new methods and tools are perceived and improvements to be implemented in order to have a more user-friendly tool.
The methodology used focuses on exploring and testing user experience (UX) methods. User-experience research methods are valuable when producing data and insights, making product and service developers efforts more effective and valuable. Taking into account the characteristics of the nuMIDAS dashboard, a series of UX methodologies have been selected and combined in the methodology shown in the figure above.
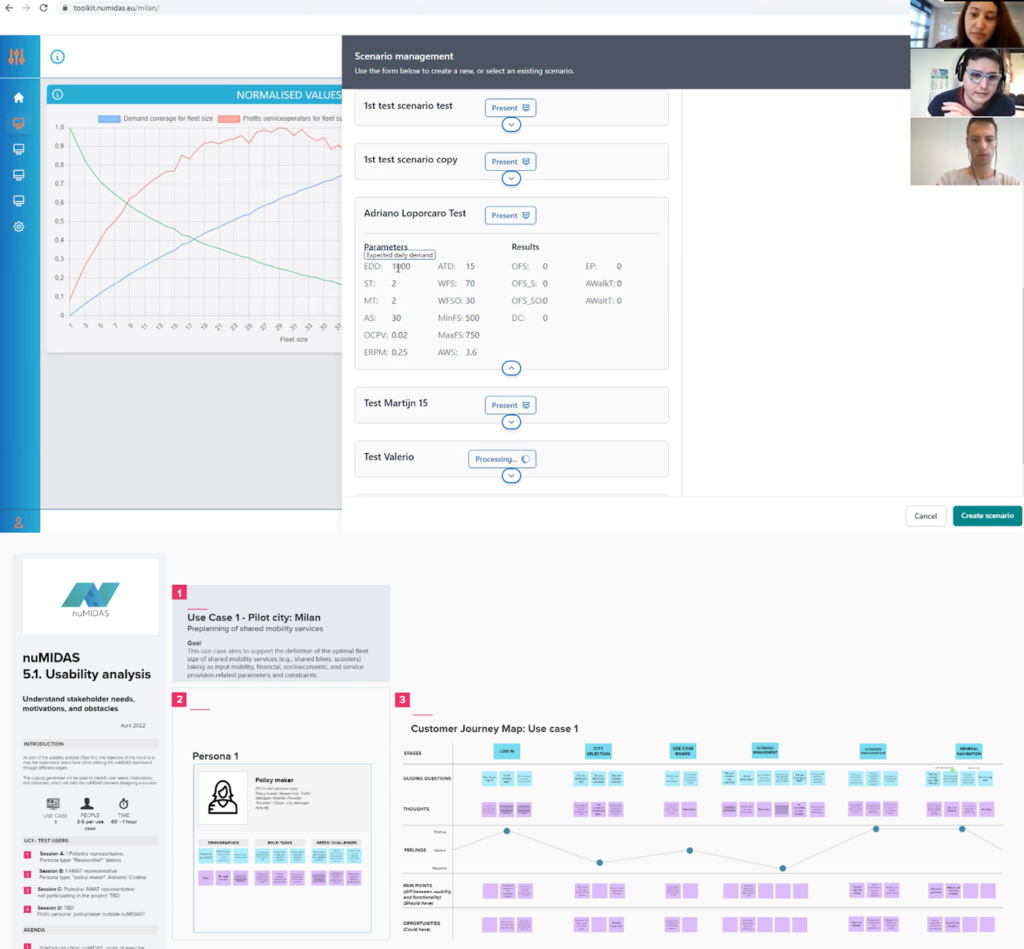
The first step of this custom-made methodology is requirements gathering, where the pilot cities are asked about their challenges and needs and how the use case should address them. Subsequently, as part of user experience exploration, personas are built that represent the potential users. This is followed by customer journey mapping to determine what actions are required to meet the user’s needs. Equipped with these UX methods, testing was then carried out in the form of a Remote Usability Study (RUS). The findings from this are analysed and classified and passed on to the bug tracking system Mantis for resolution. The whole process is iterative and repeated when necessary.
A total of 5 requirement-gathering sessions were held and 4 use cases were tested (a total of 12 interviews) regarding their usability following the RUS methodology. The methodology was developed in April and started to be tested at the end of April, lasting until December.
Following the Remote Usability Study, the results were evaluated and analysed. In addition, pain points that affected the user experience as well as opportunities for improvement were identified. The issues mentioned by the testers were classified into different categories according to Jakob Nielsen’s Usability Heuristics for User Interface Design.
The main results show that most of the requirements and usability issues raised are in the category of Aesthetic and minimalist design which particularly concerned the layout and the intuitiveness of the navigation; Flexibility and Efficiency of use related to further potential functionalities and Recognition rather than recall which refers to missing information, explanations and units. That means, that the way in which we create a new scenario and present the results needs to be clearer, that is, have more information and instructions, clearer legends and labels of fields, as well as a simpler design and coloured graphs and maps.
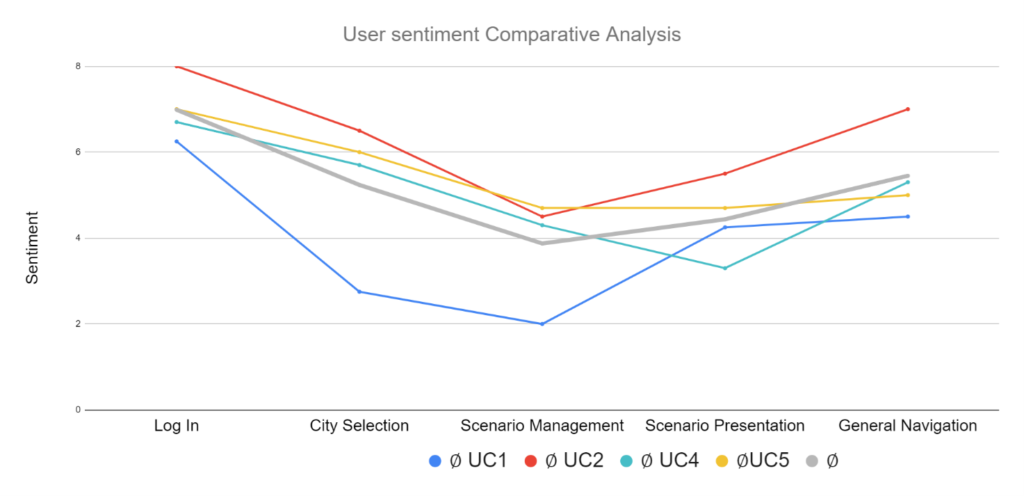
The following figure shows the results of the sentiment analysis of the usability sessions. In this analysis, a 7-point Likert-type scale was used to quantify testers’ emotions. The two extreme points negative/dissatisfied (1) and positive/satisfied (7) and (4) for neutral. It is possible to see that on average the feelings and emotions of the users were less positive and enthusiastic in the Scenario Management and Scenario Presentation, while the Log in was meet with positiveness. UC1 was the first use case to be tested, and for that reason it is possible to see an improvement of the sentiment in the Log in, City Selection and Scenario Management from UC1 to the others use cases. The feedback and issues raised of the first sessions were listen and implemented before the testing of the other use cases.
To sum up, we worked on a user-centric design approach to ensure a high level of usability of the New Mobility Data and Solutions Toolkit. For each of the six different use cases, the UX methodologies are applied and the results analysed. These results are of great importance as they were communicated to the developers via the Mantis platform and thus influence the backend and frontend development, making the nuMIDAS toolkit as user-friendly as possible. The development of a suitable and easy to use tool is key in order policy makers and mobility experts with no previous knowledge of the tool can use it and navigate easily, supporting them on the decision-making process. The full and final version of this report will be published on Project Deliverables section in the website.

